The Map: A Mythic Recollection

By Jeff Hedin
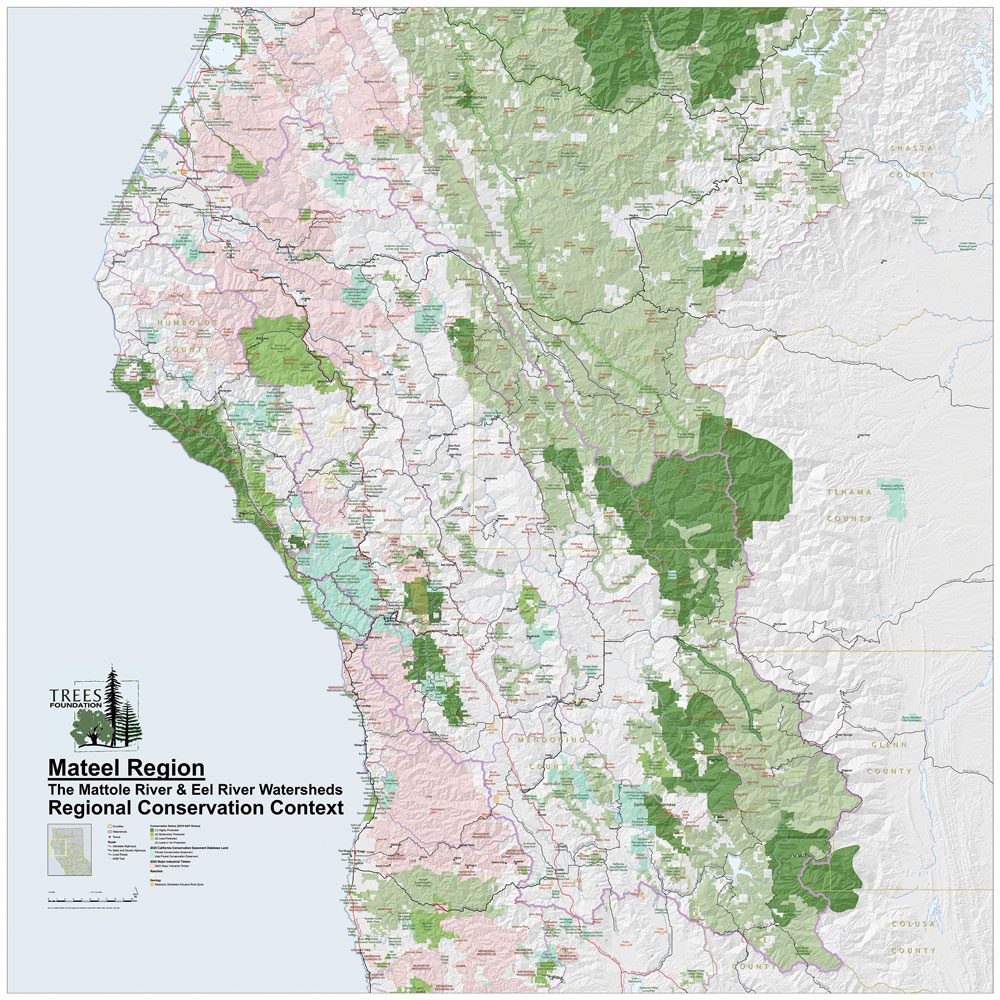
Editor’s Note: We are excited to announce that the Mateel Region Conservation Context map—23 years in the making—is now available on our website at treesfoundation.org/map. We would like to acknowledge the dedicated work of activists Jeff Hedin and Rob DiPerna in the creation of this map, and to Trees Foundation’s past GIS Specialists, Scott LaMorte and Matt Dicks. A special thank you goes to Trees Foundation’s current GIS Specialist Cullen Cramer, who overcame many technical obstacles to convert the map to WebGIS so that it can be viewed anywhere online. The following is Jeff Hedin’s story of the origins of the map and how it has served as an essential organizing tool.
Jeff Hedin’s disclaimer: Time and date errors and all omissions are innocent, not malicious. All maps need constant revision to stay relevant. Wade in, please. This history and the map itself need review.
In the fall of 1996 I found a note in my mailbox: “If you are the Jeff that knows Doug Fir, please come to the Piercy Watersheds Association meeting this Saturday, 10 am at Resting Oak. BLM wants to sell a virgin forest on the North Fork of McCoy Creek. – Ami Goldberg”
That Saturday I met Ami Goldberg, Josh Golden, Tanya Gaines, Paul Encimer, and David Bergin, and I learned the history of local land use from 160-acre homestead claims to timber company empires, harvest plans, Department of Forestry and Fire Protection, Bureau of Land Management, conflicts galore, and a newspaper clipping announcing BLM’s intention to sell some scattered tracts. Lots of emotions and opinions, but no one had a map.
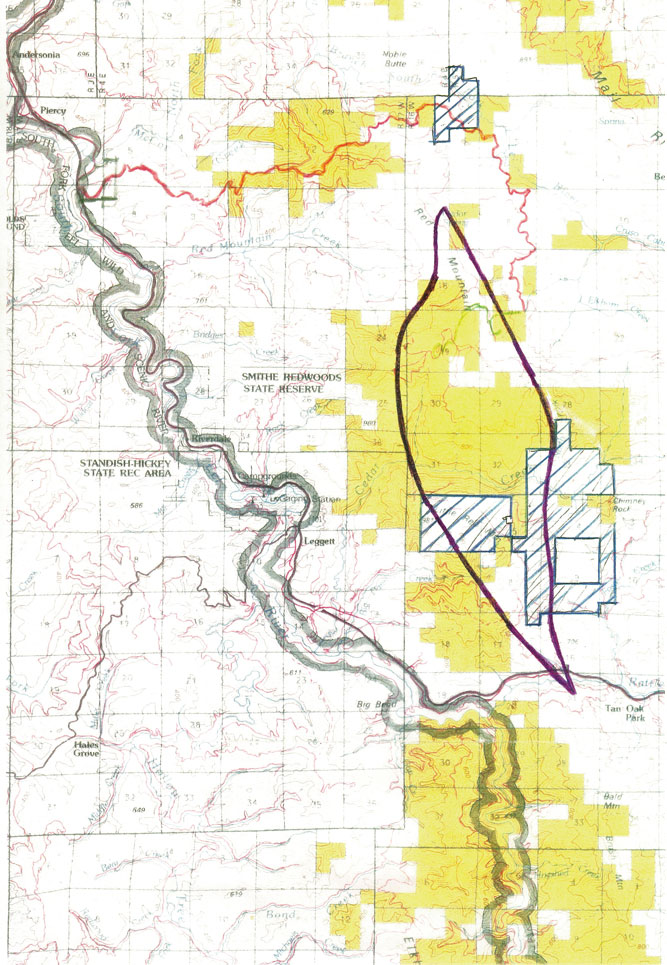
Carrying my taped-together USGS quad maps for Piercy and Noble Butte, I drove to Garberville, Madrone Realty, the source of the clipping, and met Vern Bonham. Vern rubbed his finger over a stretch of North Fork McCoy Creek and said, “Yup, I tried to buy that piece back when I was logging in this area, but BLM wouldn’t sell. Now after I gave title to my piece to Coombs in exchange for hauling logs over his property, they want to sell it to the highest bidder. No one wanted the piece during homestead days. It’s steeper than a sheep’s face, but has some nice timber. So now it’s landlocked, and Coombs has the only access to it. He won’t sell a right of way. He’ll just trade title for access when the cut is over. Leads to some ugly harvest practices…you should get a BLM map….”
I drove to the Arcata BLM office and met Linda Rousch, then BLM’s Arcata District Manager. She asked if I wanted to buy the tract. “Of course, but I doubt I can compete. But I want to know what’s up, why this piece of our public lands is for sale, and maybe again, submit an opinion.”
“Oh, commentary is closed,” she said, “Now we are answering queries from potential buyers.”
“Commentary is closed! When did it open?”
“It opened months ago.”
“Why am I hearing about this now? How was this sale announced?”
“We put a notice in the Times Standard.”
“And in the Ukiah Daily Journal?”
“No, that’s pretty far off and we felt this was only of local interest, and the trade journals would reach the commercial interests.”
“Too far away. The legal description of this piece is in a section of a township in the Humboldt Meridian, but it is located in Mendocino County and 1/2 mile closer to Ukiah than to Eureka, and the Times Standard does not come to Piercy. How were we to know that a virgin forest on public land in our watershed was about to be sold on auction? The Times Standard doesn’t cover anything in Mendocino County, not even our Supervisors’ board meetings. For local news and legal announcements I go to Leggett or Laytonville to buy the Journal, The Press Democrat, or the Chronicle. If you put it in the New York Times it would have a better chance of reaching Piercy. Sometimes I can find one at the Peg House. This can’t constitute adequate public announcement.”
Linda convened a meeting at the U.C. Ag Extension on Humboldt Hill. There we met Freeman House, Maureen Roche, David Simpson, Rondal Snodgrass, and Harriet Burgess, the Executive Director of American Land Conservancy. The purpose of this proposed sale was to purchase 160 acres of land from Eel River Sawmills and annex it to BLM’s King Range. David Simpson swore that their agreement was no old-growth for second-growth exchange. Some argued that some old growth was more important than other old growth. David replied, “We’ve been snookered,” gathered up his stuff, and stomped out.
Eventually we agreed that an offer to sell land had not been announced because the parcel was not properly identified. Commentary was extended 60 days.
Joint field trips were planned. The BLM maps were wonders with so much information that for most they confused more than they clarified. As we left, Paul Encimer asked, “How did it come to this?”
Rondall said, “You snooze, you lose.”
“Snooze!” I blurted. “We weren’t snoozing. We were standing on a scenic turnout when your out-of-control truck ran over us.”
Maureen rubbed my shoulder, and Freeman said, “We were all snoozing. I wish David were here. He thinks on his feet better than I.” It was an acidic start to long collaborative friendships.
Mapping by Hand
I went home to begin mapping how to get to this parcel that was really two pieces sharing a corner. We walked the “parcel,” tallied plants, photographed even the fishes in the creek, consulted botanists, geologists, fishery biologists. We submitted our comments.
Linda Rousch, unable to reject them, at her request sent the comments to Ed Hasty, BLM’s California Director. Ed sent them on to Washington, DC, from where a letter signed by an “Assistant Secretary of the Interior” was sent to me to report that our objections to the sale had been dismissed and no further appeal was available. The letter was postmarked Dec 27, 1997.
I called the Mendocino County Recorder’s Office and asked about the parcel’s status. I was told: “It’s been sold to Lancaster Logging.”
“Really? When?”
“December 26, 1997.”
[Long pause] “Thank you.”
I called the Sierra Club Legal Defense Fund.
“Sorry. Yes, Ed Hasty broke the law; failed to follow due process, but we won’t take him to court. We can’t get the land back. Legally, Lancaster Logging is an innocent third party. Yes, we could get him fired, but they’d just replace him with someone as bad or worse, and we’d rather work with a devil we know than a devil we don’t. But thanks for the call. I might mention this to Ed someday….”
“So what should we do?”
“Get together $30,000 and go after BLM and Ed. But if I were you, I’d start preparing to fight the harvest plan. Lancaster Logging is notorious.”
“Would you represent us?”
“No, I couldn’t sell it to the membership. Try EPIC. They have a lawyer named Sharon Duggan. She’s great.”
Sharon was. I was mapping McCoy Creek and drawing cross sections of the creek’s canyon for her when I got a call from the California Wild Heritage Campaign. “We’re seeking public support to include lands on the top of Red Mountain in the Mike Thompson Wilderness Bill. We’ve heard you’ve been there. Would you take our team up there for a recon tour?”
I met Lynn Ryan, Susan Knowlan, Stephen Day, and eventually Ryan Henson—more future colleagues. They had a map, but it was an 8 1/2 x 11 xerox copy of part of BLM’s Covelo map with the road to School Section Creek highlighted in red pencil. It showed no context whatsoever for Red Mountain.
Checking in from EPIC, Ann Seaquist found me working on three maps for projects that others had started. The Wild Heritage Field Trips had led to an urge to create a biome sequence map of Red Mountain to the Sea and to the Valley, and they were consuming me.
“You should go to Trees Foundation. They have GIS mapping. Piercy Watersheds Association is a Trees affiliate. Trees could do all this for you easy, and you could focus on our lawsuit to save McCoy Creek.” (The McCoy lawsuit won protection for trees on McCoy Creek’s floodplain and inner gorge walls and rim. Then Lancaster Logging cut everything it could, and declared bankruptcy. The American Lands Conservancy foreclosed on the property, and transferred its title to the Siskiyou Land Conservancy, its current owner.)
Mapping by GIS
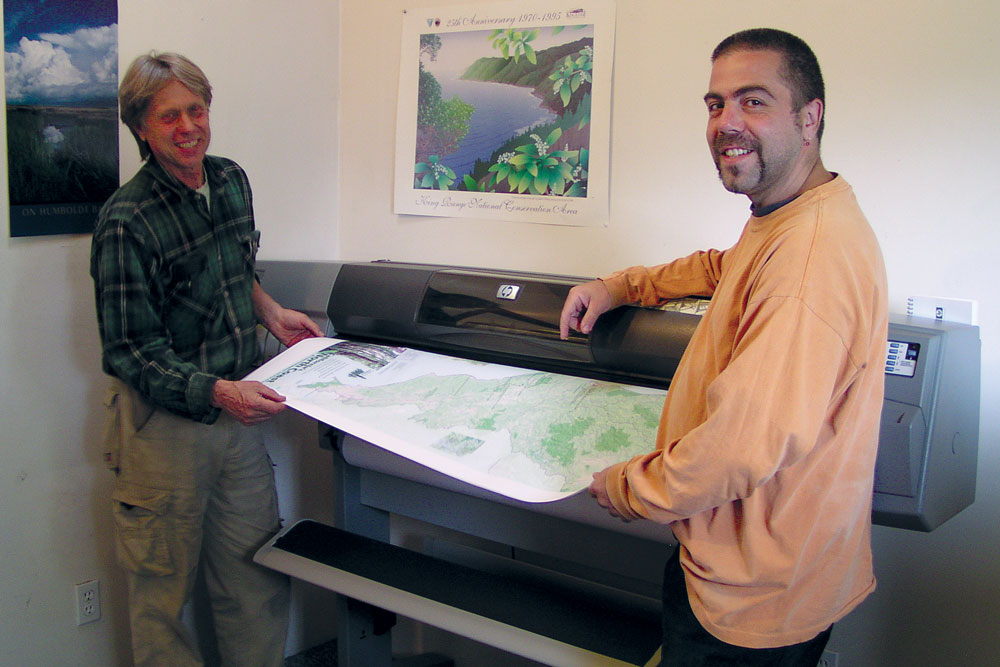
I did. In 1998 I carried my hand-colored maps and my bundle of reference maps, met Scott LaMorte (who was “Seed” in Earth First! huddles), and said, “We need a map that reveals the contextual importance of our public lands, shows people how to get to their public property, and makes them want to go. One basic map should do as the recruitment instrument for these three projects,
and more.”
Scott introduced me to the magic of modern computer-aided cartography. “Let’s start simple,” he said, pulling up my McCoy Creek map. “You don’t want it crowded, let’s eliminate the contour lines; they are a crowd by themselves. Let’s do a shadow background to reveal the basic topography.”
“Let’s try sun at 4:00 pm, Summer Solstice.” He fiddled with his keyboard, hit click, and sat back. I could see a shadow play that could be mountain ridges in shades of green. “See, here’s McCoy Creek Canyon…there’s the North Fork, the South Fork is over here. Watch.”
He fiddled with the keyboard again, and click—a blue line wiggled and twisted through the canyon. A little more fiddling and clicking and all the BLM ownership in the watershed was on the map. A little more, and all the roads were on the map. It was a stunning test drive. He had scaled and indexed and aligned the map with north parallel to the page’s edge. He had even credited his sources.
Then Scott looked at me and said, “It’s not perfect of course, no map ever is. They are always approximations ,and here we have info from the US Geological Center and Humboldt State University. Who knows who put those datasets together when? The roads especially need ground-truthing. Ownership also changes fast. Now let’s look at this corridor map to contextualize and to highlight our public lands. That will not be simple. We’ll need lots of databases. You want the map to run from the sea over Red Mountain to the east slope of the coastal range?”
“Yup.”
“For budgeting, we’re going to do our trials on 11×17 paper. What part of this do you know best?”
“Red Mountain to the Sea, and west to Bell Springs Road.”
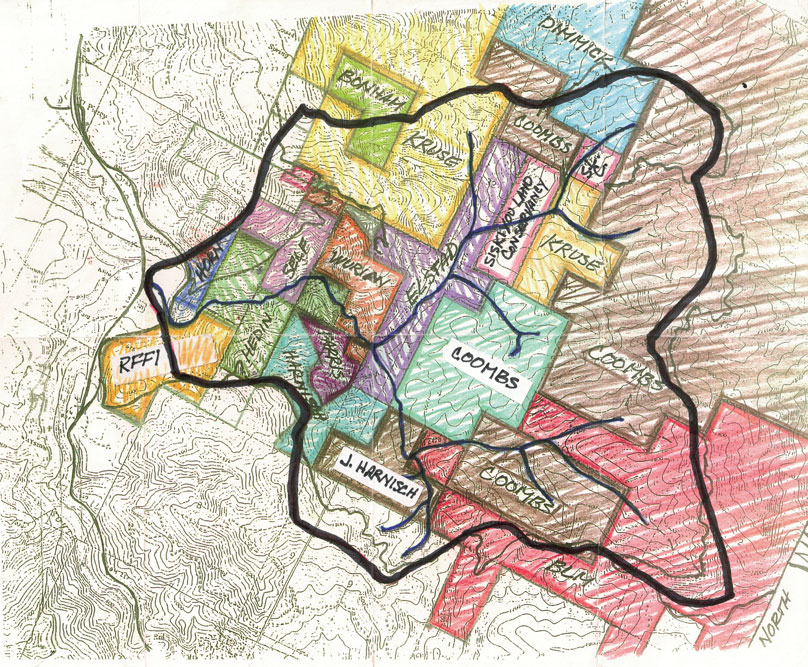
Finding a satisfactory mapping vocabulary was not easy. Scott fiddled with topo quads on the screen: Piercy, Hales Grove, Noble Butte, Leggett, Bell Springs, Tan Oak Park, Updegraff Ridge, and Iron Peak. He centered the map on Red Mountain. He cleared the contours but left the section lines. Then he took my hand-colored map and added to his screen BLM, CA State Parks, CA Dept. of Fish and Game. The bent township and blocky property lines on top of our twisty ridges, streams, and roads was a snarl of info; a Jackson Pollack sketch with hiccups. But Scott was at the wheel and eager to drive on.
Scott said, “Let’s add some color. BLM: whew, that’s dull. Dead-grass brown. The bright yellow you used for the Thompson tour is way better. Let’s use it here. Green for state parks. Blue for Fish and Game…no good, blue is for water, let’s try purple. Okay, the timber companies. How about tints and shades of oranges, various mixes of red and yellow, lots of range there. Oh, and access, let’s get BLM and State Park road layers on. What do you think?”
“It’s too busy. It’s not revealing. It’s overwhelming. My attention bounces around too much to focus….” I’ve kept copies of seven versions. We tried dozens, maybe more on the computer. The timber companies’ size and color play always stole the show. We didn’t want an anti-business map; we wanted to celebrate our public lands.
We widened the corridor north to south from Benbow to Branscomb. That was better. BLM’s King Range and Cahto Peak blocks showed that our cumulative planning had left the corridor public inclusive.
“Let’s map in the Angelo Reserve”
“Where’s that? What is it?”
“It connects BLM’s Elkhorn Ridge Tract to its Cahto Peak Tract. It’s a geo-biological research station for U.C. Berkeley.”
Scott found its boundaries, conjured it up, put it on the screen. “What color?”
“Green. Same as State Parks. Its conservation care exceeds our parks’ care.”
He tapped it in. “Okay?”
“Better. Still unbalanced and too busy.”
Scott shrugged. “Sometimes simple pictures are better.”
We trimmed content. Eventually Scott suggested that since the map was trying to show what the combined work of our public lands agencies have accomplished that we color them all green to emphasize their cumulative landscape effect. That added robustness to the public lands’ presence on the map, but it still felt industry-oriented.
I was exhausted. Scott chuckled. For him it remained an intriguing cartographic puzzle. “Look, there is an underlying theme here of conservation. Why do we call them timber companies? They just have different names, but aren’t they all playing the same game under the same rules?”
“Yeah, they all try to extract forest products profitably, and they are restrained by regulatory frameworks from our Departments of Forestry, Water Quality, Fish and Game, the Board of Forestry, OSHA, et cetera.”
“So in terms of environmental conservation and human comfort, the legal framework is the only way we can restrict them. Legally they have the same permitted role on the landscape. Color them the same. And legally, comparatively little landscape benefit is required. Make it lighter than the lowest shade of green. Pick a color.”
“Light orange?”
“Orange is red and yellow. Green is blue and yellow. In the classic color wheel, red is the opposite of green.”
“Okay, try red.”
Scott found a red that almost looked pink when just dusted onto the map, used denser pixelation for borders, and black lettering for the ownership names of industrial timber lands. We liked that it could imply license with minimal regulatory control. They were in the pink. When we picked an aqua green to distinguish NGO ownerships we had the basic mapping vocabulary that we have used ever since. However, as Scott predicted, as we updated the map, we found we had to amend the vocabulary as complexity increased.
in McCoy Creek, relabeled here as Siskiyou Land Conservancy, for their first field trip.
The Map as an Organizing Tool
What we started in 1998, we began publishing in 2002. We hung it on our walls. It inspired local letters requesting passage of a robust Thompson wilderness bill. It supported our pleas for financial support for the lawsuit to keep logging out of the McCoy Creek floodplain on the old-growth parcel that BLM had sold without restriction. I used it to revitalize participation in Piercy’s volunteer emergency service organization and to illustrate its grant proposals.
It was a tool that helped me show people the state of our landscape and the possible consequences of our collective effects. By the end of 2006 the Thompson bill was law, we had won the McCoy lawsuit, and Piercy had a full fire district board and six new certified responders.
In 2007, when RFFI (Redwood Forest Foundation Incorporated) bought Hawthorn Timber LLC’s 50,000 Usal Forest, Scott and I had to expand the Map’s vocabulary. The landscape had changed politically. As a timber company RFFI was bound by more than California’s regulatory framework. It was a 501(c)3 “not for profit” corporation with a mission statement committed to restoration forestry for environmental and community benefit; a conservation easement preventing subdivision; and a $60 million loan with management conditions from Bank of America. They were also pursuing compliance with the Forest Stewardship Council’s definitions of sustainable forestry.
This Usal Forest was not public land, and RFFI was an NGO but intended to harvest and sell timber while practicing restorative and sustainable forestry. Not green, not aqua, not low pictal red. We chose to map it with red and green diagonal stripes. The green stripes slightly wider. Hope counts.
When California Dept. of Parks and Recreation closed Standish Hickey in 2011, we pulled out the Map to convince ourselves [especially but not only in Leggett and Piercy] to keep the park open and vital, and to save its infrastructure.
That same year Pat Higgins began to formalize his crusade to revitalize the Eel River watershed’s biosphere by inviting all of us to join the Eel River Recovery Project. I went back to Trees to expand the Map to cover the entire Eel River drainage. Scott was gone. Matt Dicks had become Trees’ cartographer. We got acquainted while dusting off the Map, finding its computer records, and plunging into work.
When we started mapping the Eel River estuary, we went to see Molly Brown, the new director of BLM’s Arcata District. After a few minutes she said “I’ll get you all the data for Headwaters and any other mapping info you want.”
After the Map acquired features reaching east to the Sacramento River watershed, north to Eureka Bay, and south to Jackson State Demonstration Forest, I took a 3’ by 4’ copy to ERRP’s Salmon Festival in Round Valley. Ron Lincoln, wearing some of his Wailaki regalia, sauntered over and asked, “Where’s Kekawaka?”
I pointed “Right here.”
“That’s where I grew up.”
“Really! How did it get its name?”
“That’s what the frogs sing in the spring when they gather to make babies.”
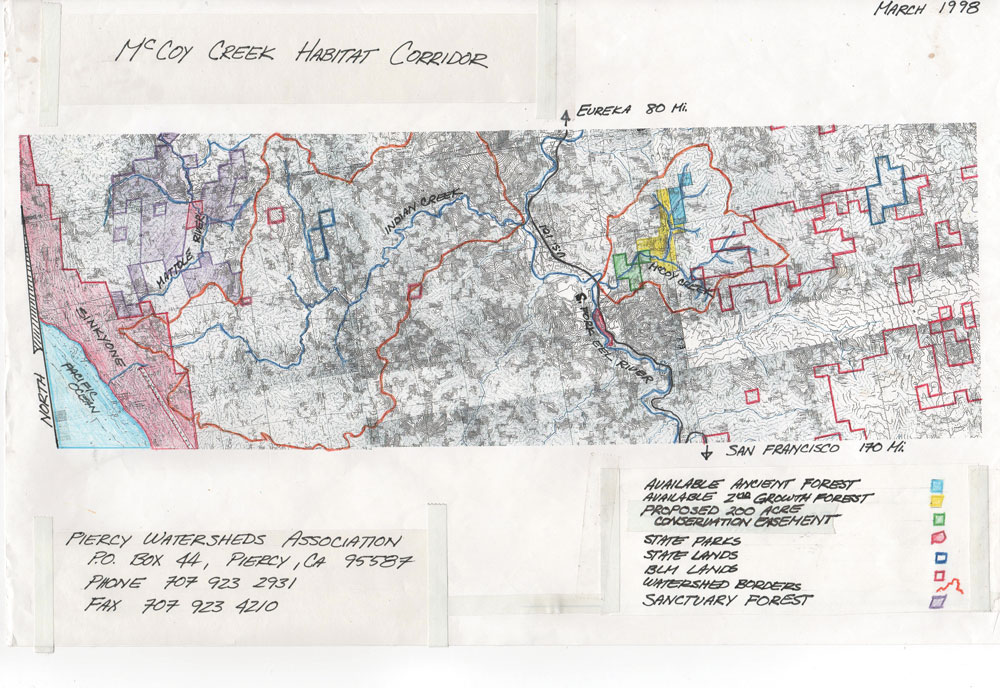
This was used in an attempt to raise money to buy BLM’s McCoy tract before it was logged.
The Map moves Online
The Map is neither finished nor fully up to date. Our region is constantly changing physically and politically. And the Map’s vocabulary will probably need revising to display what our future brings. How will we include the BLM California Coastal Monument, California Marine Protective Areas, TIMOs [Timber Investment Management Organizations], the Lost Coast Forestlands, and our Wild and Scenic Rivers?
Cullen Cramer, Trees’ current cartographer, is using the Map’s database to generate maps illustrating our plans for landscape health and fire resiliency grants. He has brought a whole new dimension to the Map: online access with entered data layers. Conjure the Map onto your screen, expand a section, put your curser on a detail, click for the dropdown, and see or read additional info. [Attention Fishing community: put in your tide charts and closure data. Historians: load it up. Road conditions on our public lands. Bird sightings.]
Trees Foundation, Cullen, and I want the Map as widely effective and appealing as possible. Feel welcome to contribute. Good data and good presentation will keep it relevant.
All life is a process of change. Good mapping can help us keep that changing joyful and life-enhancing.
treesfoundation.org/map